The 61°F Problem: Why Nitrogen Is the LNG Industry’s Fastest-Growing Headache
Authored by J Anguiano, Chief Technology Officer, Reset Energy
There’s a number worth committing to memory: 61°F (34°C). That’s the gap between nitrogen’s boiling point (−320°F) and methane’s (−259°F). It seems like a simple thermodynamic footnote, but it is the root cause of every operational bottleneck the U.S. LNG industry is increasingly dealing with as Permian Basin feed gas nitrogen content climbs.
In this post, we walk through exactly what happens, stage by stage, when nitrogen-rich gas enters a liquefaction train — and why there are no easy workarounds.
First: Where Is the Nitrogen Coming From?
Nitrogen in natural gas is geological in origin. It’s been trapped alongside hydrocarbons in reservoir formations. In the Permian Basin — now one of the primary feed gas sources for U.S. Gulf Coast LNG terminals — nitrogen concentrations are rising because operators have largely exhausted their Tier-1 acreage and are drilling into peripheral formations with structurally higher nitrogen content.
The pattern is consistent: northern Permian counties (Martin, Howard, Borden, Dawson) routinely deliver gas at 3–5 mol% nitrogen or higher. Basin-wide average nitrogen is trending upward year over year. This is not a cyclical problem — it’s a geological one.
What makes nitrogen particularly tricky is its chemical inertness. It passes through standard pretreatment systems – such as acid gas removal and dehydration – completely unchanged. While CO₂ and H₂S can be scrubbed and water vapor removed, nitrogen removal requires a specialized process. Although membrane separation and pressure swing adsorption (PSA) exist, they are rarely economical at scale, leaving the cryogenic distillation as the industry standard.
Inside the Cold Box: Where Nitrogen Does Its Damage
Because liquefaction trains are designed for a specific feed gas composition, an increase in the nitrogen content deforms the temperature-enthalpy curves inside the main cryogenic heat exchanger. This creates pinch points, or zones, where the thermal profiles of the process and refrigerant stream converge too closely. When this temperature approach narrows below design margins, heat transfer becomes inefficient and may threaten process stability. Consequently, the Mixed Refrigerant (MR) and N₂ refrigeration loops must compensate — consuming excess compressor power to maintain the required thermodynamic throughput.
The result is a double penalty:
- Less LNG produced per unit of feed gas processed
- More power consumed per unit of LNG produced
The relationship is roughly linear: each additional 1 mol% of nitrogen reduces liquefaction capacity by approximately 1.3%, due to higher BOG rates, and increases power consumption by 2–4%. At a 10 MTPA facility running at $580/tonne, that 1.3% capacity reduction translates to $75.4 million in annual lost revenue — from production loss alone, before counting heating value penalties or contract exposure.
Storage: The Cascade Nobody Wants to Manage
Depositing nitrogen-laden LNG into storage tanks shifts the operational headache downstream. Driven by the 61°F boiling point gap, nitrogen preferentially migrates to the tank headspace. This has cascading consequences:
- BOG System Overload. A jump from 1% to 3 mol% nitrogen increases BOG rates by up to 300%, Potentially choking compressors and flare systems capacities.
- Fuel Quality Degradation. The nitrogen-rich headspace gas dilutes the heating value of the fuel gas, harming gas turbine performance and accelerating component wear.
- Liquid composition changes. Continuous removal of the volatile vapor leaves behind a methane-rich liquid phase. but the nitrogen that migrated to vapor is now stuck in the tank headspace, building pressure.
To cope, operators must juggle bad options: burning low-BTU fuel, attempting BOG recirculation under choked refrigeration limits, taking the regulatory and financial hit of flaring, or forcing a rapid ship-loading window. These are stopgaps – not solutions.
None of these options eliminate the root cause. They’re all symptom management.
The Voyage: 15–20 Days of Progressive Nitrogen Volatilization
The nitrogen headache follows the asset out to sea. Over a 15-to-20-day transit, nitrogen continuously flashes into the ship’s cargo tank headspaces, creating a rolling timeline of operational issues:
- Day 0 (loading): LNG loaded at, say, 2 mol% N₂ under normal holding conditions
- Day 5 (transit): Rapid volatilization chokes marine BOG handling systems trying to maintain tank pressure setpoints.
- Day 10 (mid-voyage): BOG heating value drops; ship engines struggle to maintain combustion efficiency on nitrogen-diluted fuel gas.
- Day 15 (arrival): The cargo arrives “weathered” – the liquid has lost nitrogen, and some methane, changing its density, overall energy content, and final product volume.
The longer the voyage and the higher the initial nitrogen content, the more pronounced the effects.
The practical implications: inaccurate fuel accounting, mismatched custody transfer data, and off-specification delivery penalties. The results? Complicated billing disputes and retroactive contract exposure.
The Only Permanent Fix: Cryogenic NRU
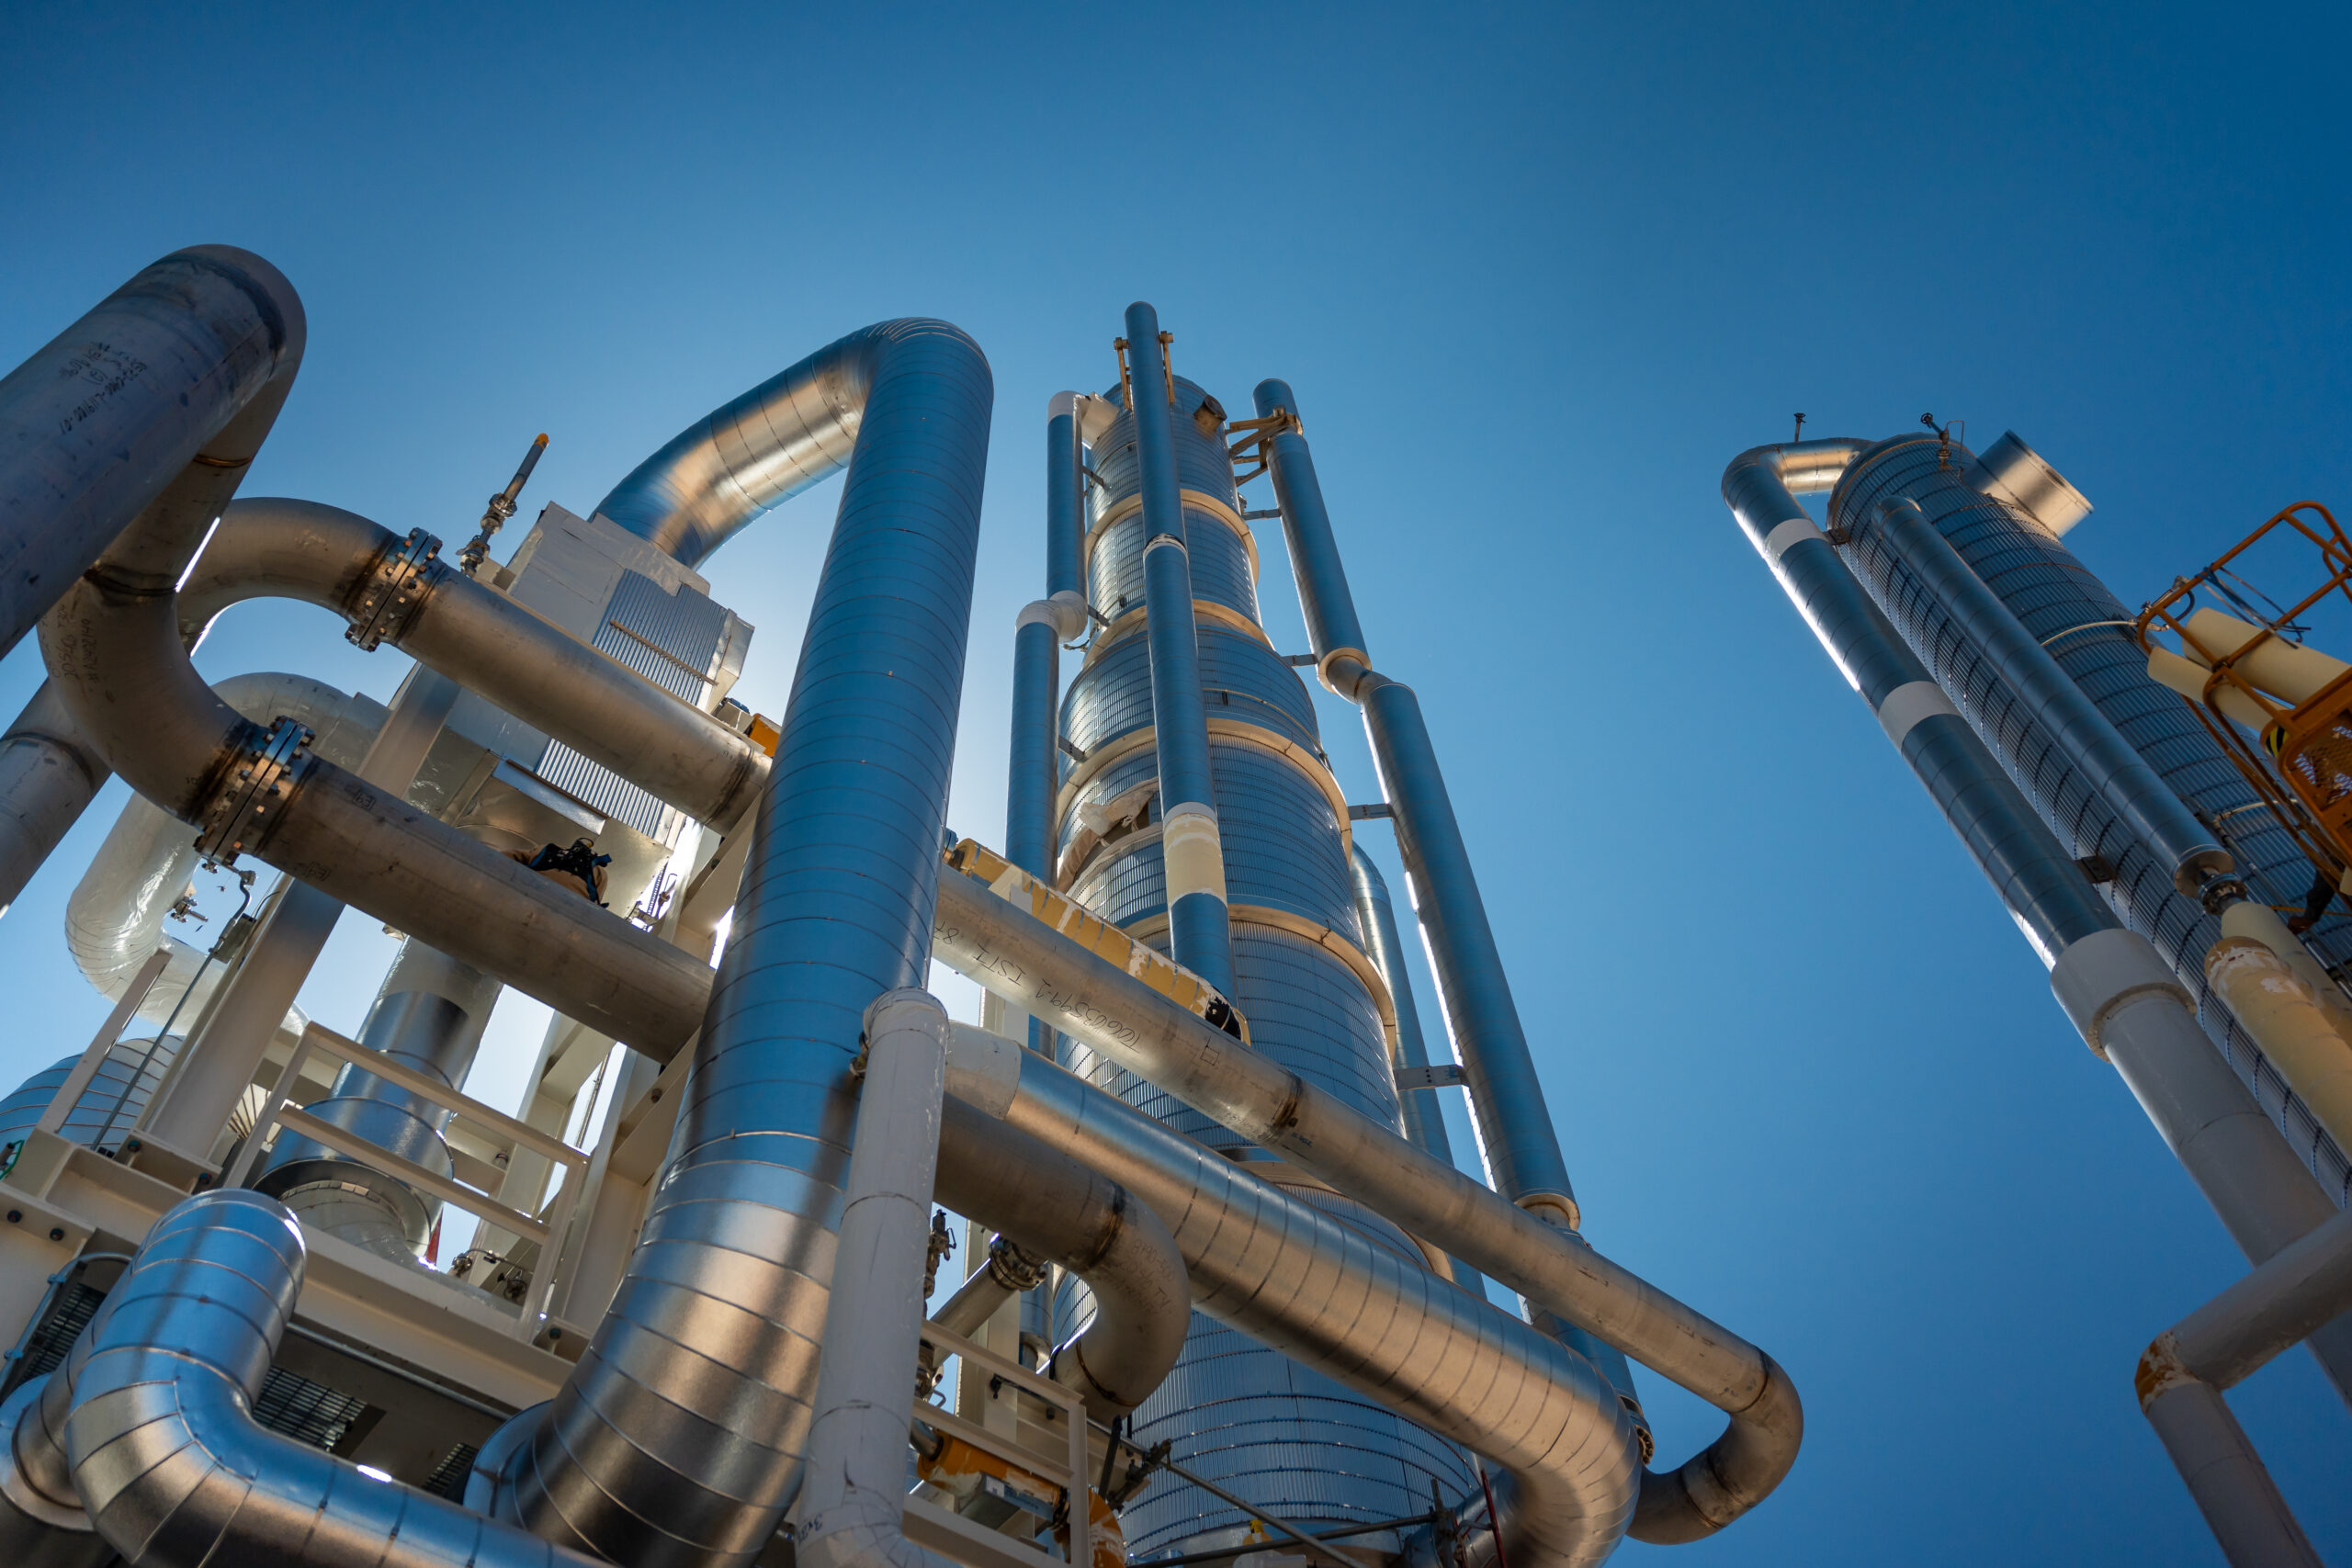
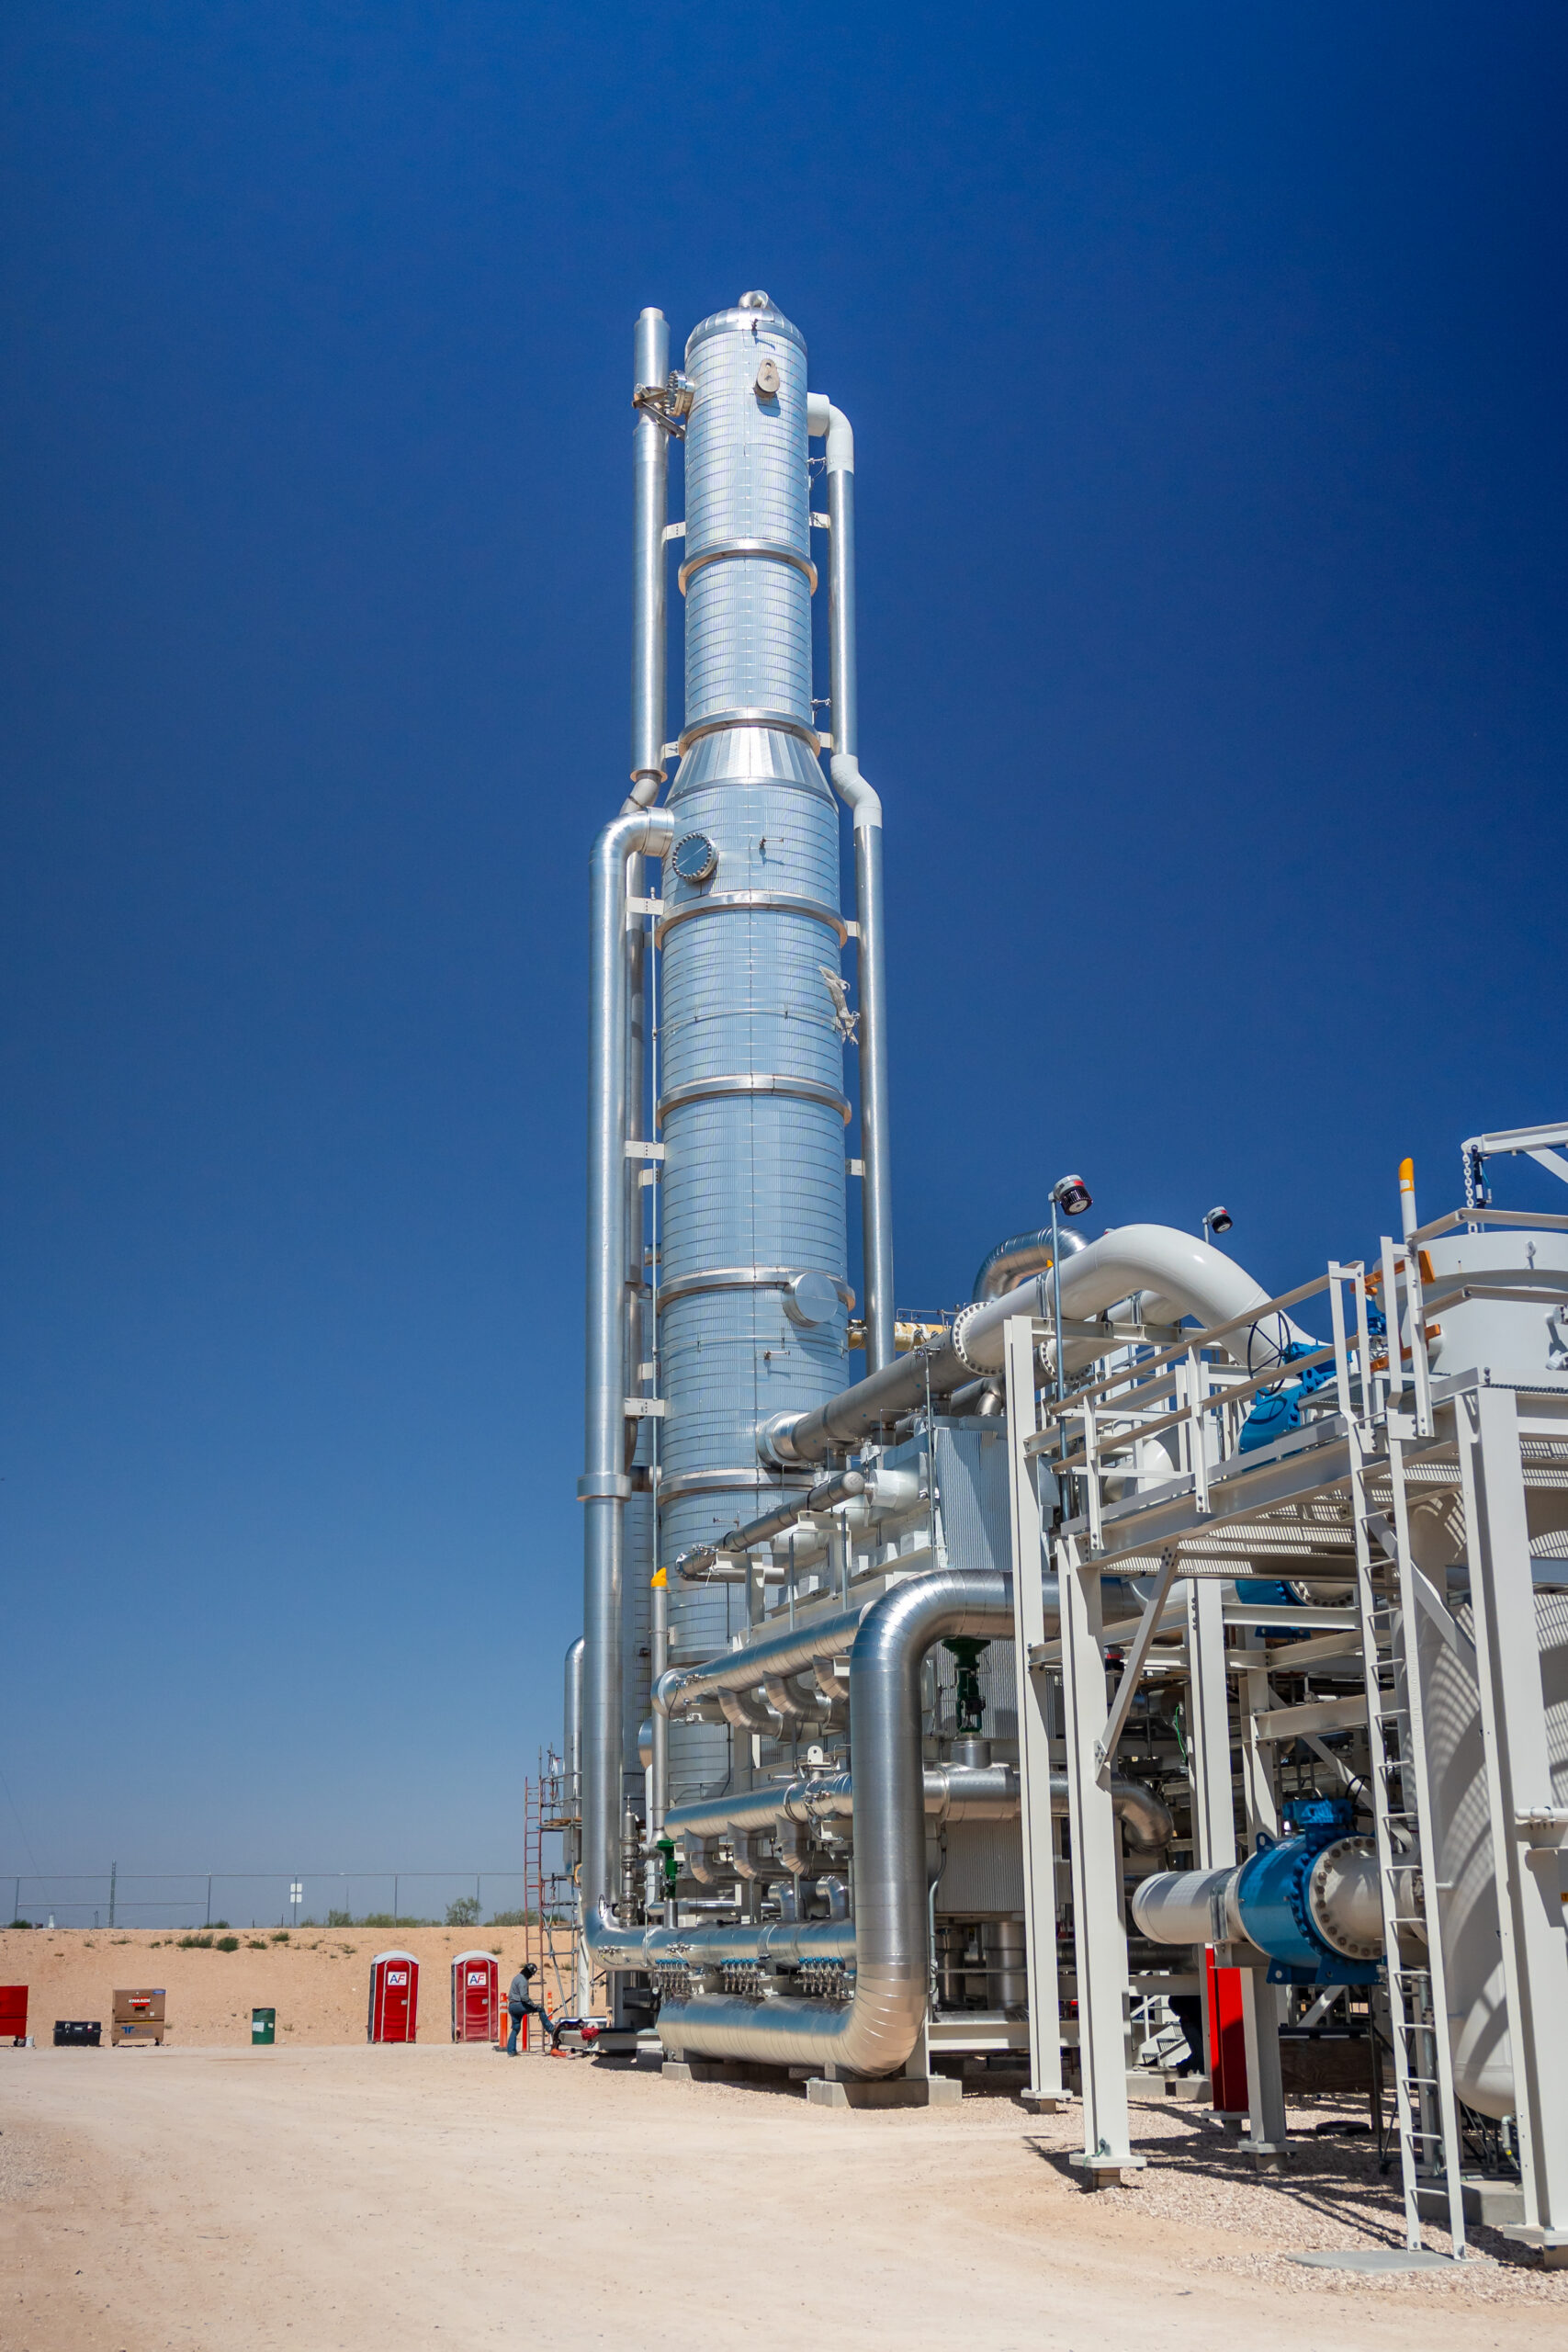
To solve the nitrogen problem, facilities must transition from managing symptoms to employing a permanent fix: a cryogenic Nitrogen Rejection Unit (NRU). An NRU uses the 61°F boiling point gap into a controlled distillation process.
As the liquified feed gas stream enters, the high-volatility nitrogen vapor rises to the top of the column to be vented, while the high-purity methane leaves the bottom of the column as spec-compliant product.
Two primary design configurations exist:
- Single-Column NRU: Simple, Low-Capex, better suited for nitrogen content above 25 mol%.
- Two-Column (Dual-Column) NRU: Includes an integrated high/low-pressure column configuration built for high-throughput efficiency on low-nitrogen content feed gas, below 25 mol% — which describes virtually all LNG feed gas. The design of choice for LNG terminals and large gathering hubs.
Placement matters enormously as it dictates the regulatory and commercial landscape.
- Location 1. At the Cryo Plant: Delivers accelerated permitting and leverages existing infrastructure, but is strictly limited to that single plant’s throughput.
- Location 2. At a Pipeline Hub: Captures economies of scale but introduces complex site integration and potential multi-party commercial agreements.
- Location 3. At the LNG Terminal: Directly addresses LNG export specifications and yields the best long-term asset economics, but introduces a 2-4 year FERC approval process that cannot be accelerated by capital deployment.
The economic justification is concrete: a $150 million NRU investment targeting a 1 mol% nitrogen reduction at a 10 MTPA facility returns its capital in approximately 24 months from recovered production alone. The business case is not subtle.
What This Means for Operations Teams
If you operate in the Permian gathering system, midstream infrastructure, or Gulf Coast LNG terminal, here’s the recommended checklist:
Process Engineering: Review your cold box design margins for N₂ sensitivity. Model your heat exchanger performance at 1% to 3% feed gas nitrogen to identify where pinch points appear relative to the current operating baselines.
Storage and Terminals: Audit BOG management capacity and flare systems. Ensure both are over-designed to handle high BOG and flare relief scenarios.
Shipping and Cargo Management: Integrate fuel heating value decay in voyage transit planning.
Commercial and Contracts: Audit the Sale and Purchase Agreements (SPAs) and identify every N₂ specification clause. Model your exposure if the Permian average N₂ rises another 0.5 mol% — because the geology says it will.
The Bottom Line
You cannot negotiate with physics: That 61°F boiling point gap between nitrogen and methane is an absolute constraint. What is negotiable is how prepared your organization is when your feed gas nitrogen content crosses a threshold that turns a manageable nuisance into a material operational and commercial crisis.
The window to secure a first-mover advantage is shrinking fast. Acting today protects your infrastructure before FERC permitting queues get longer, blending capacity runs dry, and buyers start enforcing SPA nitrogen clauses more aggressively.
Why does nitrogen cause problems in LNG production if it’s chemically inert? Its inertness is exactly the issue — nitrogen passes through standard acid gas removal and dehydration systems unaffected, so it isn’t removed until a dedicated nitrogen rejection step. Meanwhile, its low boiling point relative to methane disrupts the heat exchanger’s temperature profile inside the liquefaction train.
How much does 1 mol% of nitrogen actually cost a facility? At a 10 MTPA facility running at $580/tonne, each additional 1 mol% of nitrogen reduces liquefaction capacity by roughly 1.3%, translating to approximately $75.4 million in annual lost revenue from production loss alone — before heating value penalties or contract exposure are added.
What’s the difference between a single-column and dual-column NRU? Single-column NRUs are simpler and lower-capex, and are better suited to feed gas above 25 mol% nitrogen. Dual-column (two-column) NRUs handle high-throughput, low-nitrogen feed gas (below 25 mol%) more efficiently, which describes nearly all LNG feed gas — making dual-column the standard choice for LNG terminals and large gathering hubs.
Where should an NRU be installed — at the plant, a pipeline hub, or the LNG terminal? Each location trades off speed against economics. Plant-level NRUs permit fastest but are capacity-limited to that plant. Pipeline hub NRUs capture scale but add multi-party complexity. Terminal-level NRUs deliver the best long-term economics but require a 2–4 year FERC approval process that cannot be shortened with capital.
How long does it take to recover the cost of a cryogenic NRU? A $150 million NRU targeting a 1 mol% nitrogen reduction at a 10 MTPA facility typically pays back capital in approximately 24 months from recovered production alone.
Plan an introduction meeting today
Contact our experts today to discover how our innovative solutions can tackle your complex energy challenges